Every probe serves its own operator view
A probe instance is not only a source of readings for something else to draw: it serves an operator dashboard of its own, and norsk-ctl proxies it at /instance/
01 Analysing a live stream
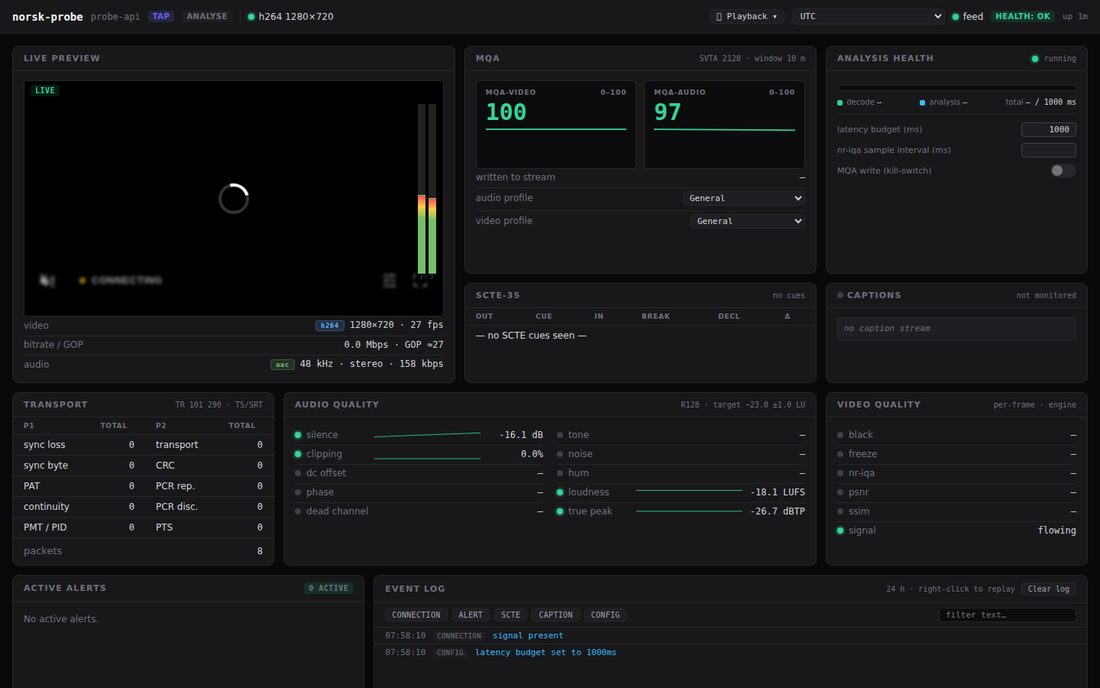
Section titled “01 Analysing a live stream”The dashboard on a real deployment, with the probe’s own low-latency preview playing beside the readings. Every number on the page arrives over the dashboard’s own data feed.
02 Two scores, not one
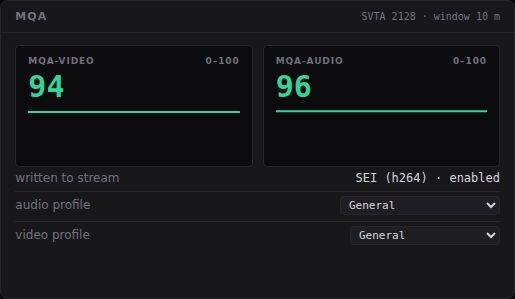
Section titled “02 Two scores, not one”MQA grades video and audio independently on 0-100, because they fail independently: a frozen picture with clean sound and a clean picture with dead sound are different faults. Each axis carries its own threshold profile, switched live — the grading changes without restarting the probe.
03 The detectors behind the audio score
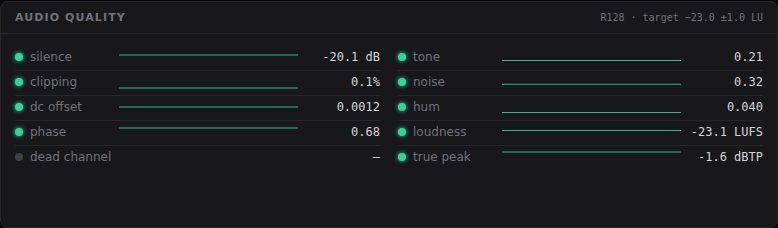
Section titled “03 The detectors behind the audio score”Loudness and true peak against the R128 target, plus what a loudness meter cannot catch: silence, clipping, DC offset, phase, tone, noise and mains hum. A greyed row is a detector with no live reading — not a healthy one.
04 And the transport underneath
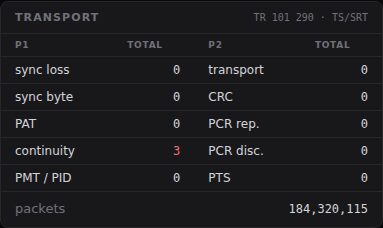
Section titled “04 And the transport underneath”TR 101 290 priority 1 and 2 counters, cumulative since the stream started. This is the layer that says whether a picture fault is really a delivery fault.
05 What has already happened
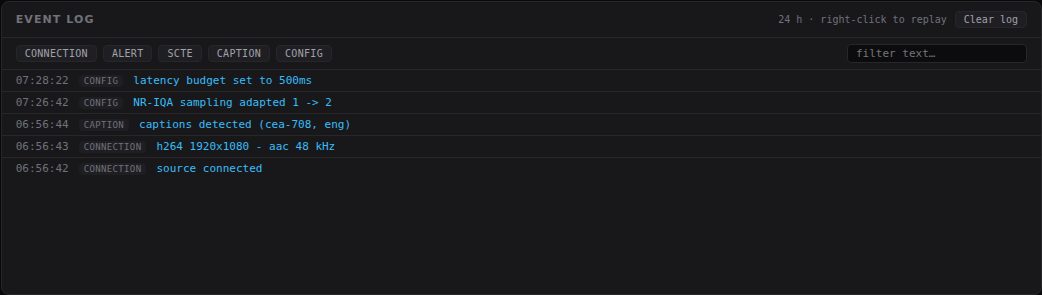
Section titled “05 What has already happened”The event log is durable and filterable by kind, so an operator arriving after the fact sees what the probe saw rather than only what is true now.
Seen in: When it goes wrong, Many probes at once, A probe on an SRT feed