What it looks like when the stream goes wrong
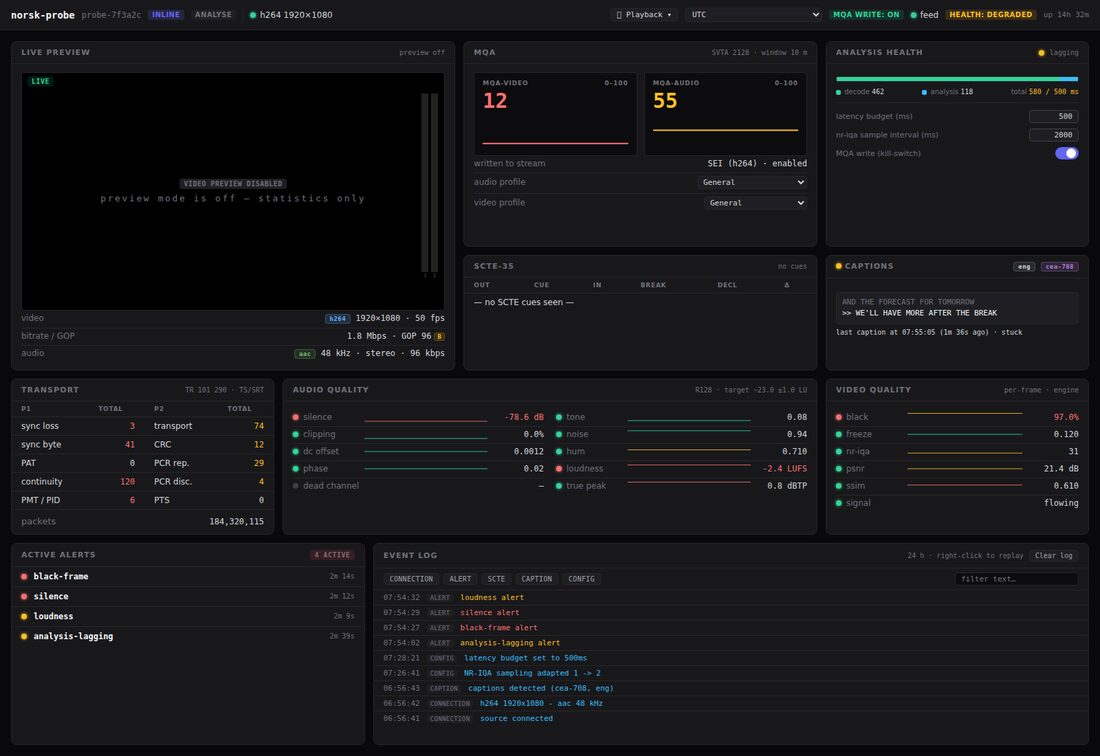
The reason to run a probe. These are the same panels in the same places — an operator does not re-learn the screen under pressure — reading a stream whose picture has gone black and whose audio has died.
01 The screen changes colour, not shape
Section titled “01 The screen changes colour, not shape”Scores collapse, the alert panel fills, the header says degraded. Nothing has moved.
02 What is wrong, and since when
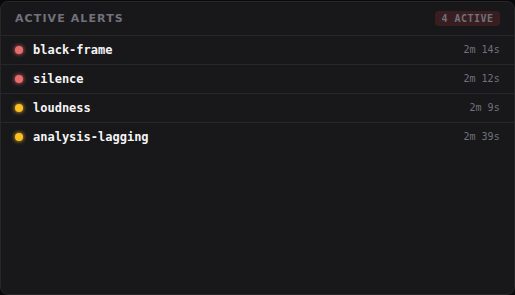
Section titled “02 What is wrong, and since when”Active alerts carry severity and the moment they were raised, so the panel answers both questions an operator has: what is failing, and whether it started just now or ten minutes ago.
03 Scored, not just flagged
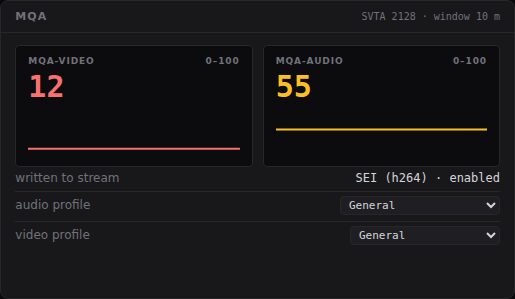
Section titled “03 Scored, not just flagged”An alert says a threshold was crossed; the score says how badly. Video has collapsed while audio is merely poor — the difference between a dead feed and a feed with a problem.
04 Is the probe itself keeping up?
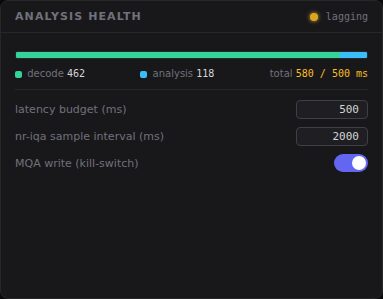
Section titled “04 Is the probe itself keeping up?”Analysis health says whether to trust the rest. Here analysis is running behind its latency budget, which is a fact about the probe and not about the stream — the dashboard never lets the two look alike.
05 The order it happened in
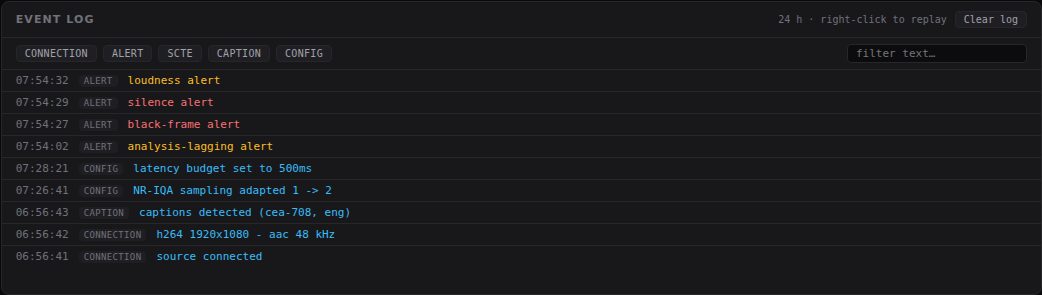
Section titled “05 The order it happened in”The event log puts the alerts in sequence against everything else the probe saw, so the picture failing before the sound is visible rather than inferred.
Seen in: The operator view, Many probes at once